Economic history 1700s–1800s
William Playfair turns accounts into lines
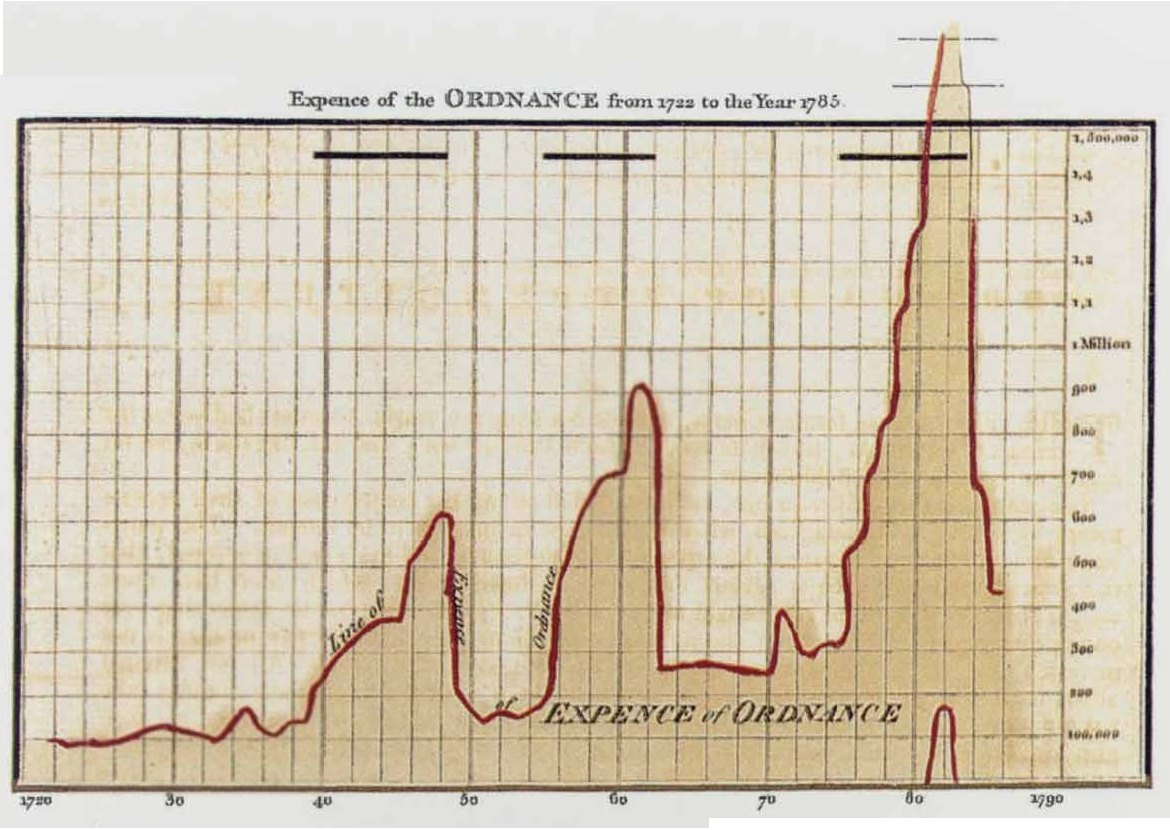
William Playfair’s Commercial and Political Atlas, first published in 1786, offered readers a different way to examine public figures. A line on a graph could make a rise, fall or comparison apparent without requiring a reader to hold a column of numbers in mind. This plate charts ordnance expenditure from 1722 to 1785; the reproduced edition dates from 1801. Its subject was military supply and artillery administration. The image belongs to the early history of statistical graphics, when familiar forms of today’s newspapers and reports were still unusual ways of making an argument.
About the picture
The horizontal axis holds years while the vertical dimension carries expenditure. Following the line lets a reader compare distant moments at a glance. Its peaks invite historical questions about war and public spending, but answering those questions requires accounts and context beyond the line itself.
The history behind it
What the source establishes
An edition date does not move the observations forward in time. Playfair’s line concerns ordnance expenditure through 1785 even when encountered in a later printing of the atlas. The visible scale and title also stop a second category error: money spent is not the number of soldiers, guns or casualties. The chart has genuine rises and falls, with a large late peak, but it cannot independently attribute that peak to a named purchase, supplier or policy. A careful catalogue caption preserves all three temporal layers and the meaning of the measured quantity.
Dates, places and close alternatives
1722–1785 describes the observations; 1786 and 1801 describe publication history. The supplied atlas context identifies a British ordnance series, rather than a universal measure of military activity. The graph supports changes in expenditure; it does not count troops or identify contractors.
A chronology of objects is not a time series
Make a small ledger with a date, its role and the evidence for that role. The endpoint of an observation series can precede both an original publication and a later edition. Once that is clear, check units just as carefully as dates. A graph of money spent cannot silently become a graph of men, guns or casualties merely because its subject is military administration.
A few things to read next
Books for a longer visit, and a few good places to start online. These are ordinary links, with no affiliate commission.
On the bookshelf
The Commercial and Political Atlas and Statistical Breviary
Playfair’s own atlas, with modern editors introducing its statistical innovations.
A History of Data Visualization and Graphic Communication
Follow the development of line graphs, bar charts and other forms around Playfair’s work.
The Visual Display of Quantitative Information
A useful companion for reading axes, scales and comparisons carefully.
Read online
William Playfair
A starting point for names, dates and related subjects. Follow its references when you want to go further.
Playfair in the history of statistical graphics
Milestone entries place Playfair’s graph forms in chronological context.
Expence of the Ordnance from 1722 to the Year 1785
The full historical plate and its source description.
Where the pictures come from
The original records and their individual rights statements are below. The pictures have not been generated or altered for the game.
Expence of the Ordnance from 1722 to the Year 1785, from Playfair’s atlas.
William Playfair, The Commercial and Political Atlas, via Wikimedia Commons · Series 1722–1785; atlas first issued 1786; source describes an 1801 third-edition reproduction
Public domain historical plate; item record identifies public-domain status.
History notes and reading lists prepared for Then & Found with AI assistance. The source institutions and authors are not sponsors or endorsers. Suggest a correction or another source


