History of chemistry 1860s
Mendeleev’s first periodic system
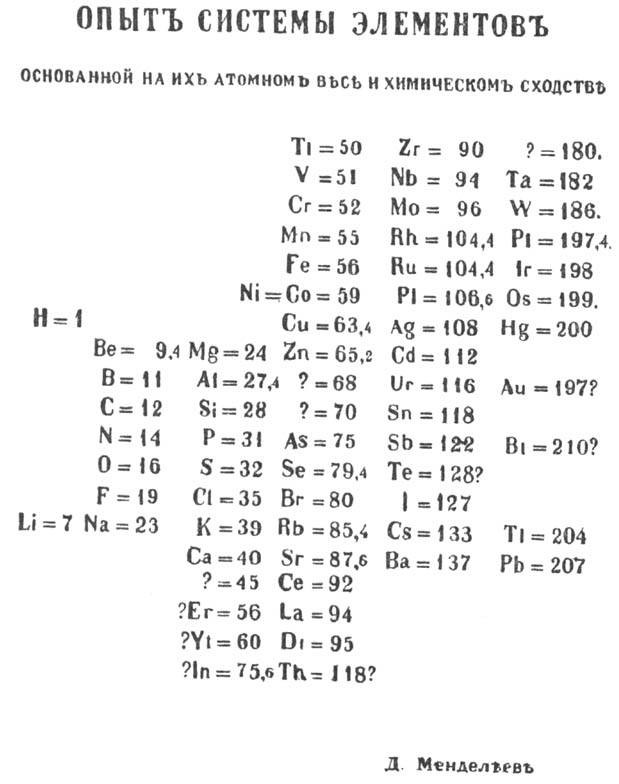
In 1869, Dmitri Mendeleev tried to arrange the known elements using atomic weights and chemical similarities. The result looks unfamiliar beside a modern classroom table, but its purpose is recognisable: make a complicated body of knowledge reveal an order. Question marks left room for elements or values that were not yet securely known. Those gaps were a productive feature of the system, not merely unfinished typesetting. Subsequent discoveries and revisions changed the arrangement, while the later understanding of atomic number supplied a different foundation for the periodic table used today.
About the picture
The entries combine element symbols and atomic weights rather than modern atomic numbers. Question marks show where an incomplete inventory might still follow a pattern. Mendeleev’s table was therefore a working proposal: it organised established information while also making expectations that later chemists could investigate.
The history behind it
What the source establishes
The question marks matter because the document is a system under construction. Its own heading identifies atomic weight and chemical similarity as its principles, and its numerical entries should be read within that historical framework. The 1869 system is therefore not a badly typeset modern school chart. Shared or uncertain values belong to the record and should not be silently corrected using later chemistry. The packet establishes the author, language, date and the presence of uncertainty; judging the later success of every proposed entry would require additional sources.
Dates, places and close alternatives
The catalogue identifies the first 1869 system, rather than a modern atomic-number revision. The script, translated heading and author attribution identify a Russian-language Mendeleev record. The explicit principles and uncertain entries support a working classification, with no claim of perfect finality.
Preserve historical quantities before comparing them
Comparison with a modern reference works only after identifying what the older number means. A historical atomic weight is not interchangeable with atomic number. Preserve the uncertain entries and ask which later evidence would genuinely test their proposed relationships. The relevant comparison concerns the classification’s own principles and documented discoveries, not a numerical match produced by switching to a different modern organising quantity.
A few things to read next
Books for a longer visit, and a few good places to start online. These are ordinary links, with no affiliate commission.
On the bookshelf
The Periodic Table: Its Story and Its Significance
A detailed history of the table’s scientific development, including its earlier competing systems.
The Periodic Table: A Very Short Introduction
A shorter route into periodicity and the table’s changing foundations.
Mendeleyev’s Dream: The Quest for the Elements
A narrative history of chemistry leading toward Mendeleev’s nineteenth-century synthesis.
Read online
Dmitri Mendeleev
A starting point for names, dates and related subjects. Follow its references when you want to go further.
Development of the periodic table
A historical guide to arrangements before and after Mendeleev.
Finding the periodic table
The people and earlier developments behind the familiar chemical system.
Where the pictures come from
The original records and their individual rights statements are below. The pictures have not been generated or altered for the game.
Mendeleev’s first periodic system, 1869.
Dmitri Mendeleev, first periodic-system table, via Wikimedia Commons · 1869
Public domain: author died in 1907; item page identifies life-plus-100 and pre-1931 publication status.
History notes and reading lists prepared for Then & Found with AI assistance. The source institutions and authors are not sponsors or endorsers. Suggest a correction or another source


