Public health 1850s
John Snow and the Soho cholera outbreak
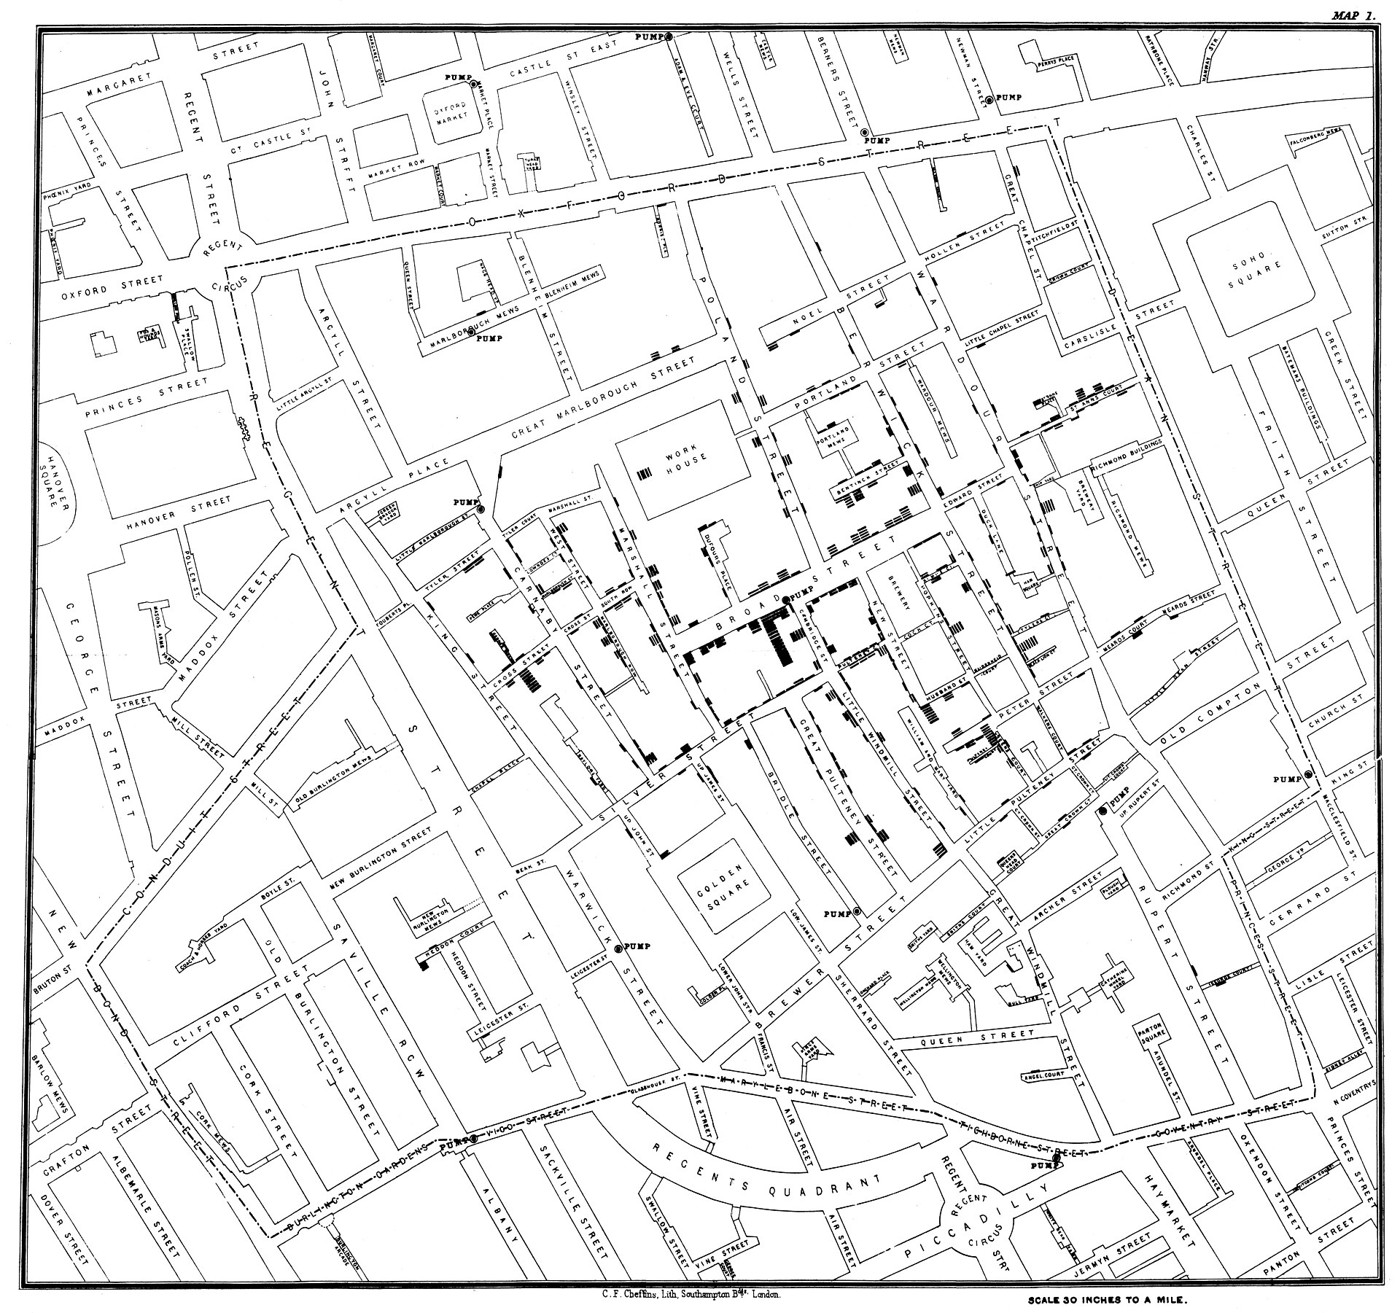
In late summer 1854, cholera struck the streets around Broad Street in Soho. John Snow investigated where people had died and where they obtained drinking water. His argument challenged explanations that blamed unhealthy air alone. The familiar map was published in his 1855 account: short black bars accumulate beside affected addresses, while nearby pumps offer possible sources of exposure. Snow also used interviews and comparisons beyond this neighbourhood. The map mattered because it made a local pattern visible; the investigation mattered because it asked how that pattern had come about.
About the picture
The bars represent deaths, building up along streets rather than filling entire districts with colour. Pumps are another kind of mark, letting readers compare illness with a shared resource. Snow’s geographical picture was one part of an argument about water, supported by information about people’s habits and water supplies.
The history behind it
What the source establishes
The difficult distinction is between a useful lead and a proved mechanism. Snow’s map puts recorded deaths and public pumps into a shared geography, making the concentration around Broad Street meaningful. It does not provide a census denominator for every block or show the water consumed by every individual. The sound next action is to investigate those missing exposures and exceptions. The 1854 outbreak date should also remain separate from the 1855 publication of Snow’s book and the much later digital reproduction.
Dates, places and close alternatives
The observations belong to the 1854 Soho outbreak; publication and reproduction are separate dates. Broad Street and Golden Square identify Soho, not the riverside districts in the alternatives. The pattern warrants checking water consumption; it does not itself measure individual exposure or isolate a pathogen.
Addresses, exposures and denominators
An address locates a recorded death, while an exposure describes what someone actually drank. Those are linked questions, not interchangeable measurements. A visually dense block may also contain more people. Compare population at risk, ask about water sources, and investigate exceptions before treating a cluster as a complete causal account. The next source should answer a specific missing question rather than merely repeat the same geographical pattern.
A few things to read next
Books for a longer visit, and a few good places to start online. These are ordinary links, with no affiliate commission.
On the bookshelf
On the Mode of Communication of Cholera
Read Snow’s full argument, including evidence that does not appear on the famous map.
The Ghost Map
A narrative account of the outbreak, the neighbourhood and the investigation.
A History of the World in 12 Maps
Place this local disease map within a much longer history of mapping.
Read online
1854 Broad Street cholera outbreak
A starting point for names, dates and related subjects. Follow its references when you want to go further.
150th Anniversary of John Snow and the Pump Handle
An account of Snow’s investigation and its place in epidemiology.
On the Mode of Communication of Cholera, 1855
Read the map within Snow’s contemporary published explanation.
Where the pictures come from
The original records and their individual rights statements are below. The pictures have not been generated or altered for the game.
Map associated with John Snow’s account of the 1854 Soho cholera outbreak.
John Snow / Charles Cheffins; digital reproduction via Wikimedia Commons and UCLA · 1854 outbreak; reproduced in Snow’s 1855 book
Public domain; the item record identifies the historical map and its reproduction as public domain.
History notes and reading lists prepared for Then & Found with AI assistance. The source institutions and authors are not sponsors or endorsers. Suggest a correction or another source


